Strategic AI Project Selection and Decision Matrix Analysis for DaisyDoof Inc.
Authors’ note: This AI-supported business analysis paper experiment was completed for a class at Purdue University. I used Gemini Notebook (Google, 2026) to produce a project selection report and visualizations based on instructor guidance. Gemini Notebook synthesized the provided source data and generated a draft manuscript. I used ChatGPT (OpenAI, 2026) to refine the manuscript. The abstract and sections 1-7 of this paper are AI-generated. Human oversight consisted of validating and revising sources, calculations, citations, paraphrased claims, grammar, and formatting. The Section 8 reflection is my own work. This paper is not published in any academic journals, nor has it been peer-reviewed. All evidence and claims should be considered preliminary.
Abstract
DaisyDoof Inc. is evaluating four technology initiatives to expand its service offerings: an AI-powered customer service chatbot, a predictive maintenance platform, a blockchain-based supply chain tracker, and a personalized marketing engine. This report applies a multi-criteria decision analysis (MCDA) framework to compare the projects across projected five-year return on investment, risk, strategic alignment, resource requirements, and market demand, while retaining project duration as a supporting descriptive factor. The recommended scoring coefficients were proportionally normalized to sum to 1.00, and risk and resource requirements were transformed as cost criteria so that higher standardized values consistently represented more desirable outcomes. Weighted composite scores were converted to a true 0–100 decision index. Project D, the Personalized Marketing Engine, ranked first with a score of 75.00, followed by Project B at 72.92, Project A at 69.44, and Project C at 34.72. Risk-return analysis and resource comparisons indicate that Project D provides a strong balance of projected return, strategic alignment, assessed risk, and implementation duration, although it does not dominate every individual criterion. One-way sensitivity analysis further shows that the preferred project changes under sufficiently different weighting priorities: lower emphasis on ROI favors Project A, while greater emphasis on ROI or substantially lower emphasis on risk favors Project B. The results support Project D under the baseline decision model while demonstrating that the recommendation remains conditional on organizational priorities and weighting assumptions.
Keywords: artificial intelligence, project management, business analysis, project selection, AI governance, data analysis, workforce automation, human oversight
Introduction and Strategic Context
As enterprise technology landscapes evolve, expanding corporate services requires sophisticated portfolio management techniques to maximize return on invested capital while safeguarding organizational assets. DaisyDoof Inc. is evaluating four mutually exclusive technology project proposals designed to expand its current service portfolio. Selecting the optimal project requires moving beyond simple metrics, such as Expected Monetary Value (EMV), toward a comprehensive Multi-Criteria Decision Analysis (MCDA) model (Dean, 2022; Schuyler, 1995). Budgeting metrics frequently fail to capture poor planning, resource constraints, poor risk management, and strategic misalignment (Gładysz & Kuchta, 2022; Shabbir et al., 2023).
Candidate Project Overview
The project selection committee has compiled quantitative operational data for four candidate proposals:
Project A (AI-Powered Customer Service Chatbot): Designed to automate customer interaction channels, reduce support operational costs, and elevate user satisfaction. It features a 5-year potential ROI of $1,200,000, low risk exposure (Risk Score = 2), maximum strategic alignment (5/5), moderate resource demands (5 FTEs), market demand rating of 4/5, and a rapid 9-month execution timeline.
Project B (Predictive Maintenance Platform): Targeted at industrial equipment analytics and enterprise IoT integration. It delivers the highest nominal 5-year potential ROI of $1,800,000 and peak market demand (5/5), but carries elevated execution risk (Risk Score = 4), heavy staffing demands (8 FTEs), and an extended 15-month development lifecycle.
Project C (Blockchain-Based Supply Chain Tracker): Focused on multi-party supply chain transparency and distributed ledger tracking. It projects a 5-year ROI of $900,000, moderate risk (Risk Score = 3), lower strategic alignment (3/5), a resource commitment of 6 FTEs, a market demand rating of 3/5, and a 12-month development timeline.
Project D (Personalized Marketing Engine): Aimed at real-time consumer behavior analytics and hyper-targeted service delivery. It promises a strong 5-year potential ROI of $1,500,000, low risk exposure (Risk Score = 2), maximum strategic alignment (5/5), resource commitment of 7 FTEs, strong market demand (4/5), and an efficient 10-month time-to-market.
Dataset Analysis and Quantitative MCDA Methodology
The project selection analysis evaluates four candidate initiatives using five decision criteria: 5-year potential return on investment (ROI), Risk Score, Strategic Alignment, Resource Requirements, and Market Demand (Table 1). Project Duration is retained as a supporting descriptive factor but is not included in the weighted composite score. The criteria combine monetary values, ordinal ratings, and staffing requirements measured on different scales, so they require normalization before weighted aggregation. Proportional weights reduce bias across contrasting measurement units (Dodgson et al., 2009).
Table 1: Raw Quantitative Project Dataset and Operational Parameters
| Project | Initiative | 5-Yr Potential ROI | Risk Score | Strategic Alignment | Resource Requirements | Market Demand | Duration (Months) |
|---|---|---|---|---|---|---|---|
| A | AI Customer Service Chatbot | $1,200,000 | 2 | 5 | 5 FTEs | 4 | 9 |
| B | Predictive Maintenance Platform | $1,800,000 | 4 | 4 | 8 FTEs | 5 | 15 |
| C | Blockchain Supply Chain Tracker | $900,000 | 3 | 3 | 6 FTEs | 3 | 12 |
| D | Personalized Marketing Engine | $1,500,000 | 2 | 5 | 7 FTEs | 4 | 10 |
Note. Risk Score is measured on a 1–5 ordinal scale, where 1 represents the lowest assessed risk and 5 represents the highest. Strategic Alignment and Market Demand are measured on 1–5 scales, where higher values indicate greater desirability. Duration is used as a supporting descriptive factor and is not included in the weighted MCDA calculation.
Normalization and Transformation Mechanics
Normalization is required in multi-criteria decision analysis when criteria use different units, ranges, or magnitudes because unnormalized values can disproportionately influence aggregation results (Roszkowska, 2026; Vafaei et al., 2022). Roszkowska (2026) identifies linear max–min normalization as a common MCDA procedure that maps criterion values to a common interval while preserving proportional differences among alternatives. Vafaei et al. (2022) likewise present max–min normalization for benefit and cost criteria within Simple Additive Weighting models.
The conventional max–min transformation produces values on a [0, 1] interval. For this analysis, normalized values were linearly rescaled to a [1, 5] desirability interval so that transformed ROI, Risk Score, and Resource Requirements could be interpreted consistently with the existing 1–5 Strategic Alignment and Market Demand scales.
For a benefit criterion, where higher raw values are more desirable, the standardized rating is:

For a cost criterion, where lower raw values are more desirable, the direction is reversed:

Where xij represents the raw value for project i on criterion j, xjmin and xjmax represent the applicable minimum and maximum values, and:

Roszkowska (2026) notes that max–min normalization provides direct comparability across criteria and is commonly used with linear aggregation models, although results can remain sensitive to extreme values and changes in the set of alternatives.
Potential ROI
Potential ROI is treated as a benefit criterion. The observed project values range from 0.90 to 1.80 million dollars:

The resulting standardized ROI ratings are:

Risk Score
Risk Score is a cost criterion measured on a fixed 1–5 ordinal scale. Unlike ROI and Resource Requirements, its theoretical scale endpoints are known and are therefore retained rather than recalibrated to the observed project range of 2–4. Applying the cost transformation using the fixed bounds 1 and 5 simplifies to:

The resulting desirability ratings are:

Resource Requirements
Resource Requirements are treated as a cost criterion because lower staffing commitments are preferred. The observed project values range from 5 to 8 FTEs:

The resulting standardized resource ratings are:

Strategic Alignment and Market Demand already use 1–5 desirability scales and therefore require no further transformation.
ROI and Resource Requirements use the observed extrema of the four-project dataset, while Risk Score uses the fixed bounds of its defined ordinal scale. This distinction preserves the meaning of the Risk Score scale while allowing continuous criteria to be compared on a common basis. Because observed extrema define the ROI and Resource transformations, adding an alternative outside the current range could change the normalized values of existing projects, a known limitation of max–min normalization (Roszkowska, 2026).
Criteria Weight Normalization
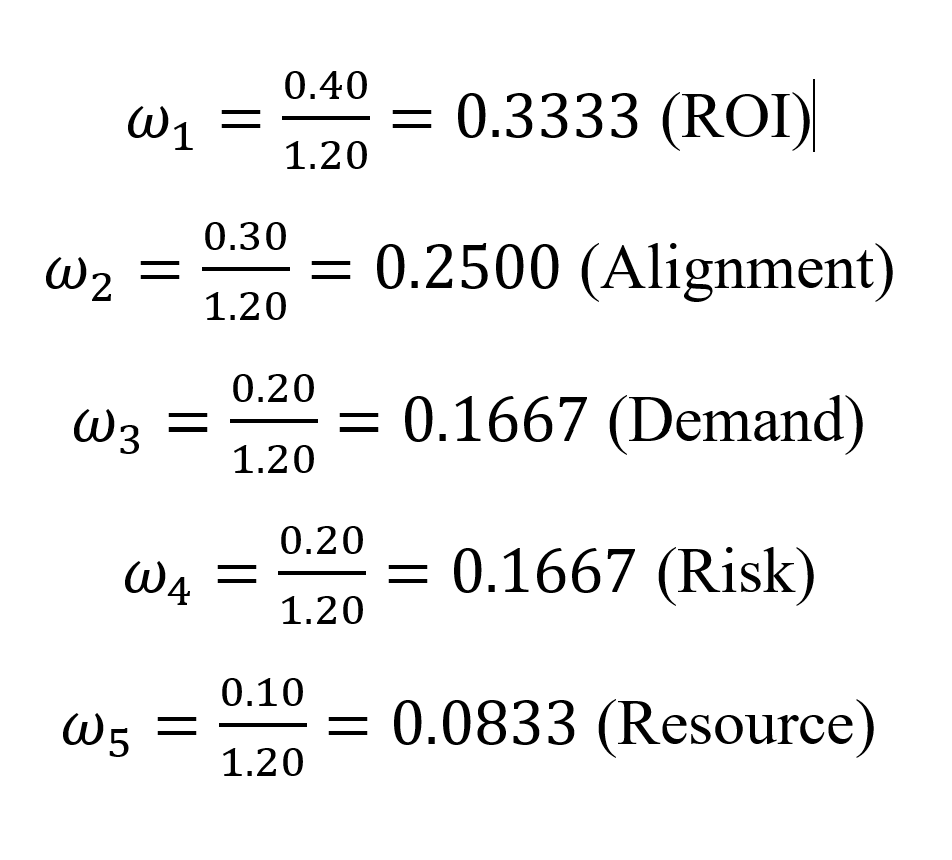
The recommended weighting scheme assigned 40% to Potential ROI, −20% to Risk Score, 30% to Strategic Alignment, −10% to Resource Requirements, and 20% to Market Demand. The negative signs identify Risk Score and Resource Requirements as cost criteria, for which lower raw values are preferred. Because both criteria were transformed into positive desirability scores during normalization, their weights are applied as positive values in the final aggregation model.
Using the absolute magnitudes of the recommended coefficients:

The coefficients were proportionally normalized to preserve their relative importance while producing a conventional total criterion weight of 1.00. For each criterion j:
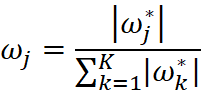
where ωj* is the originally recommended coefficient and ωj is the normalized aggregation weight.
The resulting normalized weights are:
Thus:
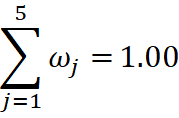
Risk Score and Resource Requirements receive positive weights in the final model because normalization has already reversed their direction. Higher standardized values therefore represent more desirable performance across all five criteria.
Table 2: Normalized Decision Matrix and Criterion Weights
| Project | ROI | Strategic Alignment | Market Demand | Risk | Resource Requirements |
|---|---|---|---|---|---|
| A | 2.333 | 5.000 | 4.000 | 4.000 | 5.000 |
| B | 5.000 | 4.000 | 5.000 | 2.000 | 1.000 |
| C | 1.000 | 3.000 | 3.000 | 3.000 | 3.667 |
| D | 3.667 | 5.000 | 4.000 | 4.000 | 2.333 |
| Weight | 0.3333 | 0.2500 | 0.1667 | 0.1667 | 0.0833 |
Note. Displayed weights are rounded to four decimal places. Calculations use the unrounded normalized values.
Weighted Composite Scoring Equations and Calculations
Multi-Criteria Composite Weighted Score
The aggregate composite score Si for project i across K = 5 criteria is calculated using a weighted linear sum:
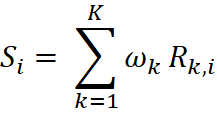
For the present model:

Standardized Composite Decision Index Normalization (0–100 Scale)
Because all criterion ratings lie on a 1–5 desirability scale and the normalized weights sum to 1.00, the theoretical weighted composite-score range is:

The composite score is converted to a true 0–100 standardized decision index using::

Project D Computation:


Project B Computation:


Project A Computation:


Project C Computation:


The baseline weighted model therefore produces the following project ordering:
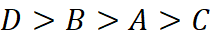
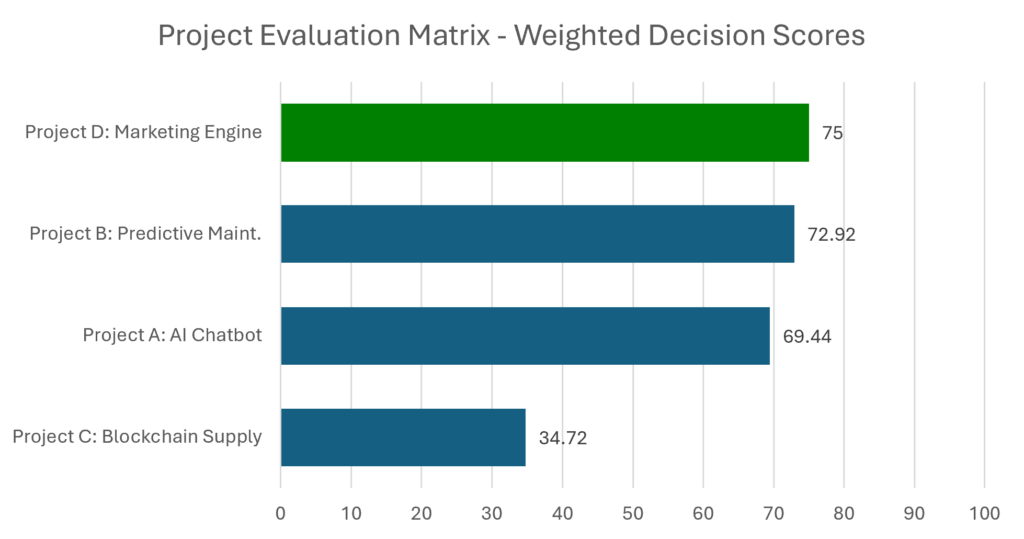
Project D achieves the highest standardized decision index at 75.00, followed closely by Project B at 72.92. Project A scores 69.44, while Project C is substantially lower at 34.72. These scores establish the baseline ranking used in the subsequent risk-return and sensitivity analyses and are charted in Figure 1.
Figure 1: Standardized Multi-Criteria Composite Decision Index Across Candidate Projects
Portfolio Risk-Return Profile and Resource Efficiency
A critical weakness of traditional evaluation methods is assessing potential returns using heuristic or qualitative judgment without applying adequate criteria weighting (Wei, 2025). Figure 2 maps the four projects across the two-dimensional risk-return spectrum, incorporating human capital commitments (bubble size) and strategic alignment (color density).
Figure 2: Project Risk Exposure versus Potential 5-Year Financial Return Matrix
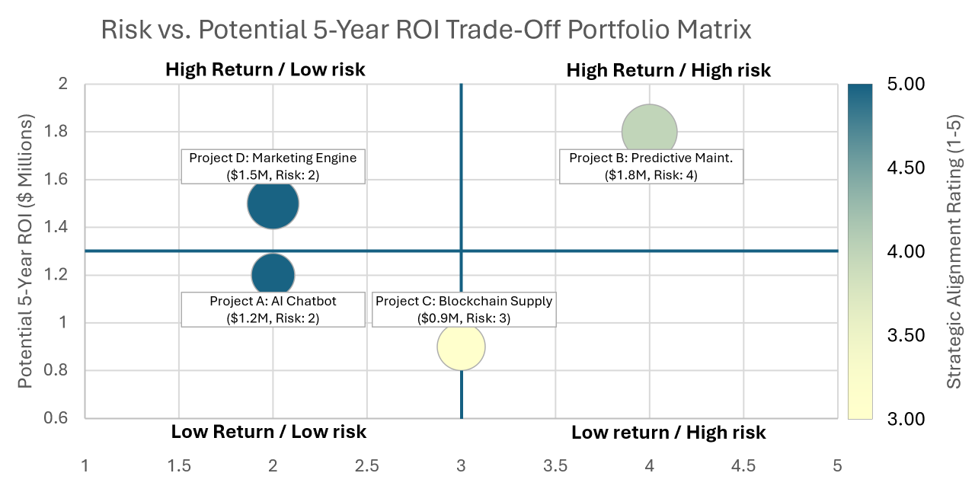
Note. Bubble size corresponds to full-time equivalent (FTE) staffing requirements; color intensity reflects strategic alignment rating (1–5). The optimal decision space occupies the high return / low risk quadrant.
Figure 2 positions Project D in the high-return, low-risk quadrant, with a projected 5-year ROI of $1.5 million and a Risk Score of 2. Project D produces approximately $214,286 in projected ROI per FTE. Project B provides the highest absolute return at $1.8 million and a slightly higher projected ROI per FTE of $225,000, but it carries a Risk Score of 4, requires 8 FTEs, and has a 15-month duration. Project D requires 7 FTEs and has a 10-month duration. The comparison indicates that Project B offers greater financial return and slightly higher return per FTE, while Project D combines strong financial performance with a lower assessed risk rating and shorter implementation timeline. Project A produces the highest projected ROI per FTE at $240,000 and carries a Risk Score of 2. However, its projected 5-year ROI of $1.2 million is lower than both Project D ($1.5 million) and Project B ($1.8 million).
Sensitivity Analysis and Ranking Stability
Criteria weights can materially affect the ranking produced by multi-criteria decision models. Pamučar et al. (2017) describe sensitivity analysis of criteria weights as a means of evaluating how changes in relative criterion importance affect alternative rankings and the stability of an MCDA solution. Accordingly, a one-at-a-time (OAT) weight sensitivity analysis was applied to the baseline weighted additive model. In each analysis, one criterion weight was varied while the remaining weights were proportionally rescaled to preserve their relative relationships and maintain a total weight of 1.00. This proportional redistribution approach is consistent with established MCDA sensitivity procedures (Pamučar et al., 2017; Yazdani et al., 2022).
Figure 3: Sensitivity Analysis of Project Decision Index Under ROI Weight Variations
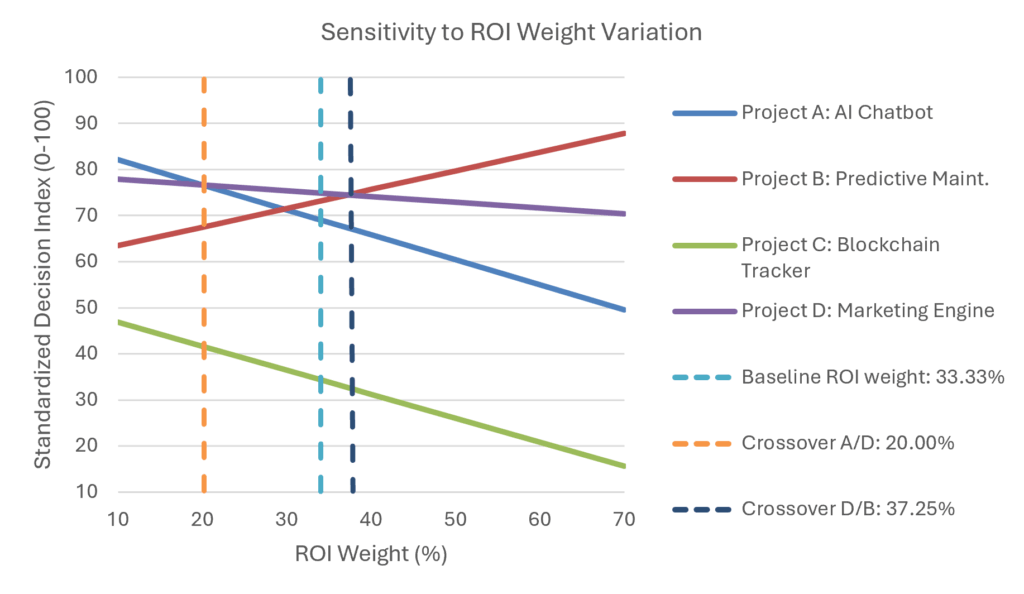
Figure 4: Sensitivity Analysis of Project Decision Index Under Risk Weight Variations
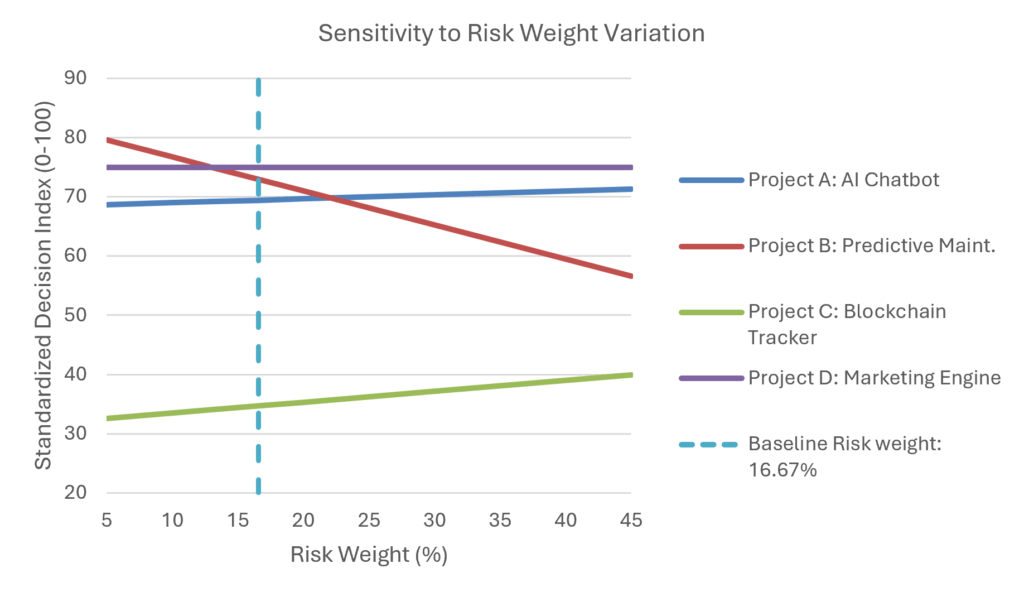
Note. Panel A varies the Potential ROI weight from 10% to 70%; Panel B varies the Risk Score weight from 5% to 45%. Remaining criterion weights are proportionally rescaled so that total weight remains 1.00. Vertical reference lines identify baseline weights and ranking crossover points.
Figures 3 and 4 present the resulting standardized decision indices. Figure 3 varies the Potential ROI weight from 10% to 70%. Project A ranks first when ROI receives less than 20% of total decision weight. Project D ranks first between 20% and approximately 37.25%, including the baseline ROI weight of 33.33%. At approximately 37.25%, Projects D and B are tied; above this threshold, Project B becomes the highest-ranked alternative.
Figure 4 varies the Risk Score weight from 5% to 45%. Project B ranks first when Risk receives less than approximately 13.04% of total decision weight. Projects B and D tie at approximately 13.04%, after which Project D ranks first for the remainder of the tested range. At the baseline Risk weight of 16.67%, Project D retains its first-place ranking.
The sensitivity analysis indicates that Project D’s baseline ranking is stable within a defined range of decision preferences but is not dominant under all weighting assumptions. Greater emphasis on financial return favors Project B, while substantially reducing the importance assigned to risk also favors Project B. Lower emphasis on ROI favors Project A. These crossover points identify the weighting conditions under which the preferred project changes and provide decision makers with a transparent basis for evaluating how strategic priorities affect project selection.
Strategic SWOT Analysis and Resource Constraint Assessment
The quantitative MCDA provides a structured comparison of project-specific financial, risk, strategic, and resource criteria, but it does not capture broader technological and market conditions that may influence implementation. A comparative SWOT analysis (Figure 5) therefore supplements the quantitative evaluation. Strengths and weaknesses were derived directly from the Innovate Solutions project dataset, while opportunities and threats were informed by open-access academic research and authoritative industry guidance relevant to each technology category. External evidence is used to identify plausible environmental conditions and does not imply that these conditions currently exist within Innovate Solutions.
Figure 5: Resource Allocation Timeline Mapping and Comparative Strategic Portfolio SWOT Matrix (Google, 2026)
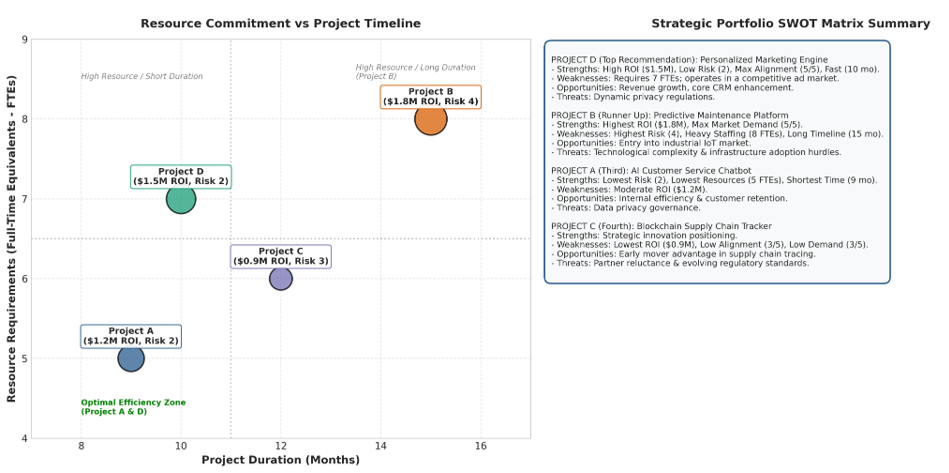
Note. Panel A maps FTE staffing against project duration in months (bubble size = 5-year ROI). Panel B presents a comparative matrix of Strengths, Weaknesses, Opportunities, and Threats for Projects A through D.
Qualitative Assessment by Initiative
Project D (Personalized Marketing Engine): Project D combines a projected five-year return of $1.5 million with a Risk Score of 2, Strategic Alignment of 5/5, and a 10-month implementation duration. Its principal internal weakness is its 7-FTE requirement, which exceeds Projects A and C. Personalized advertising research suggests that effective personalization can increase customer engagement, but the same literature identifies privacy concerns as a potential source of reduced engagement and advertising avoidance (Sourya & Chattopadhyay, 2025). AI-based digital marketing also introduces privacy and ethical governance concerns surrounding behavioral data and user tracking (Saura et al., 2024).
Project B (Predictive Maintenance Platform): Project B provides the highest projected return at $1.8 million and the strongest Market Demand score at 5/5. These benefits come with the highest Risk Score, largest staffing requirement, and longest duration. Predictive-maintenance research indicates that data-driven maintenance can reduce downtime and operational costs while improving productivity (Mallioris et al., 2024). Implementation, however, depends on reliable operational data and integration across IoT and OT systems. (Chan, 2026) identifies fragmented machine data and architectural and governance differences between IT and OT as continuing challenges for AI-enabled industrial operations.
Project A (AI Customer Service Chatbot): Project A requires the fewest FTEs, has a 9-month duration, and combines a Risk Score of 2 with Strategic Alignment of 5/5. Its projected return of $1.2 million is lower than Projects B and D. Empirical customer-service research indicates that chatbot effectiveness depends on accurate query interpretation, clear responses, usability, and appropriate task fit (Sonntag et al., 2025). Customer-service LLMs also present risks from hallucinated or incomplete responses, which can undermine trust in both the system and the service provider (Larsen et al., 2026).
Project C (Blockchain Supply Chain Tracker): Project C has moderate staffing and assessed risk but the lowest projected financial return, Strategic Alignment, and Market Demand scores. Blockchain technologies nevertheless have documented potential to improve supply-chain traceability and provenance through shared traceability records (Stouffer et al., 2022). Current research identifies substantial barriers involving interoperability, infrastructure investment, stakeholder participation, privacy, scalability, and integration with existing systems, which constrain implementation maturity (Payandeh et al., 2025).
Strategic AI-Driven Project Selection Workflow
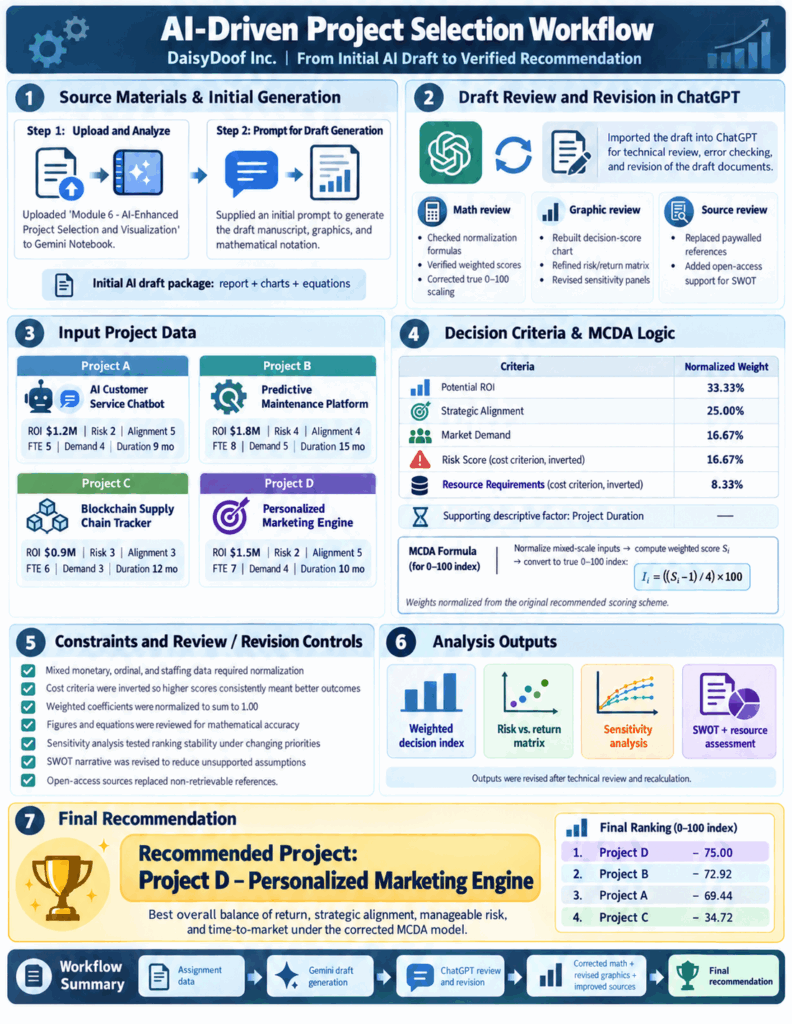
(OpenAI, 2026)
Final Executive Recommendation
Based on the multi-criteria decision analysis, Project D, the Personalized Marketing Engine, is recommended under the baseline weighting model. Project D achieves a standardized decision index of 75.00, compared with 72.92 for Project B, 69.44 for Project A, and 34.72 for Project C. Its first-place ranking results from its combined performance across the evaluated criteria rather than dominance on any single measure.
Project B provides the highest projected five-year ROI at $1.8 million, and a slightly higher projected ROI per FTE than Project D. Project A requires the fewest FTEs, has the shortest duration, and provides the highest projected ROI per FTE. Project D nevertheless combines a projected five-year ROI of $1.5 million with a Risk Score of 2, Strategic Alignment of 5/5, Market Demand of 4/5, a 7-FTE resource requirement, and a 10-month duration. Relative to Project B, Project D sacrifices $300,000 in projected return while carrying a Risk Score two points lower, requiring one fewer FTE, and reducing the implementation duration by five months.
The sensitivity analysis indicates that this recommendation depends on the decision weights management assigns. Project D ranks first at the baseline ROI weight of 33.33% and Risk weight of 16.67%. When ROI receives less than 20% of total decision weight, Project A becomes the highest-ranked alternative. When ROI exceeds approximately 37.25%, Project B becomes the preferred alternative. Project B also becomes the highest-ranked project when the Risk weight falls below approximately 13.04%. These crossover points show that Project D provides the strongest overall fit under the baseline assumptions, but the preferred project changes when organizational priorities shift materially.
The recommendation should therefore be treated as structured decision support rather than an unconditional selection. Before authorizing the project, decision makers should validate the weighting assumptions, confirm the underlying project estimates, and assess technology-specific implementation opportunities and threats identified through the supporting SWOT analysis. Any material change to expected ROI, risk, staffing requirements, market demand, or strategic alignment should trigger recalculation of the decision model.
Reflections from the human in the loop
AI-Reasoning
For this project, I used a weighted scoring system, but I did not explicitly choose it myself. I provided the prompt,
Identify the top project based on a weighted scoring system where Potential ROI is weighted at 40%, Risk Score at -20% (lower is better), Strategic Alignment at 30%, Resource Requirements at -10% (lower is better), and Market Demand at 20%. Show the calculations.
and Gemini reasoned to apply a multi-criteria decision analysis (MCDA) framework to the assessment. Gemini’s reasoning output did not explain why it chose that method, but the literature for this project supports its use. All of the calculations used are in Section 2. Gemini also inverted the risk score and resource requirements into positive scales. Although it did not explain why it did this. I conducted additional manual research and included Roszkowska (2026) in the report to support my normalization method.
Section 2 went through multiple iterations before it reached a final draft. Gemini’s first draft failed to normalize the criteria, skewing the calculations. Some formulas were variations of existing formulas. I refined these calculations by aligning with published research and prompting ChatGPT to rewrite the section as necessary.
Image Generation
Gemini generated images for figures 1-5. The project includes one bar chart, two bubble charts, and two straight-line X-Y scatter charts. Descriptions and their relation to the analysis are discussed in their relevant body text.
Figures 1-4 were generated from the first-iteration calculations and manually recreated after subsequent calculation revisions. I found it easier to recreate the charts manually, and it also improved visual consistency. Figure 5 remained accurate through the revision phase, so I left it as is. I did not explicitly define what type of charts I wanted in my original prompt. Gemini chose them as part of its reasoning. The Figure 1 bar chart remained an appropriate visualization of the results of extensive calculations, even though it required revision. I revised Figure 2 to include risk quadrants missing from the first draft. I felt the bubble size corresponding to FTEs and the color intensity reflecting the strategic alignment rating were appropriate, so I left those elements intact. I recreated Figures 3 and 4 in their entirety because Gemini did not plot the data properly in the first iteration. They now reflect appropriate sensitivity weights along with vertical elements to distinguish baselines and intersections.
Section 6 includes an AI-generated workflow that captures the high-level process of generating the report and providing a recommendation. I created this in ChatGPT toward the end of the project and leveraged project and chat history context. The representation of the workflow is accurate and appropriate for use in an executive brief.
Limitations and Strengths
This project proved to be more challenging than it initially appeared. While the final project reflects strengths in its adherence to the project instructions and benefited, overall, from time savings, hallucinated AI output required extensive review and cleanup and somewhat negated the efficiency gains. These limitations occurred in four primary domains: 1. Cited references; 2. The SWOT analysis; 3. Mathematical weight interpretation; and 4. Mathematical notation.
Although Gemini was asked to cite relevant sources, it pulled from references that were either unrelated or inaccessible. Remediation required reviewing every cited source and cross-referencing stated claims with open-access references that provided the necessary support. This resulted in some claims being manually rewritten and the output source being replaced with a verifiable source. For example, the raw generated introductory paragraph claimed “Selecting the optimal project requires moving beyond simple unadjusted financial metrics, such as Return on Investment (ROI) or Net Present Value (NPV), toward a comprehensive Multi-Criteria Decision Analysis (MCDA) model” and cited Saaty (2008). Saaty was not initially retrievable, and ChatGPT recommended Vafaei et al. (2022) as a replacement. Vafaei et al. did not fit the claim, so I continued refining my source selection and claim structure until I developed a statement supported by Dean (2022) and Schuyler (1995). I had to repeat this process for several other claims being made in the generated manuscript. I eventually retrieved Saaty through a Purdue Library request, but a review of that paper showed it would not have been an adequate reference in the first place.
Furthering the reference issues, a SWOT analysis relies on external data to compile its opportunities and threats quadrants. This information was not explicitly available to Gemini, and it output generic, unverified claims. Specific prompting of ChatGPT allowed it to link relevant sources to the SWOT analysis and provided additional references that Gemini missed. This allowed the SWOT, although it remained plausible without direct correlation to Innovative Solutions Inc.’s actual opportunities and threats, to be grounded in empirical research rather than inferred from general market conditions.
Gemini also failed to normalize the weight interpretation of dataset criteria. This led to erroneous computations of the four project decision scores. These errors then carried over to the graphics generated for Figures 1, 3, and 4 and their corresponding prose. With assistance from ChatGPT, I rebuilt the formulas in section 2.2 so the calculations would provide correct, normalized output. These calculations now align with empirical practices described by Dodgson et al. (2009), Roszkowska (2026), and Vafaei et al. (2022). I then updated the figures manually based on the new calculations, rather than regenerating them with an AI tool, and updated the analysis using new ChatGPT output based on the updated calculations. Subsequently, the final recommendation and project abstract were also updated to reconcile all new calculated values
Mathematical notation was also difficult to translate from AI output into the final document. Both Gemini and ChatGPT provided notation in chat, but when copied into Word, the formatting was stripped, and only the markup remained. Fixing this required manually constructing each formula and equation in Word using its formula tool. While the end result is clean, manual transcription introduces additional risk of error from typos, which I discovered through further review iterations with ChatGPT.
Overall, what I encountered with AI-generated risk in this project supports the research I have been conducting in my dissertation and provides personal validation of my CNIT 581 capstone project. Project managers encounter risks with AI output, but observed evidence of the decisions and actions they take to remediate those risks remains limited. The issue becomes a question of appropriate reliance. If I had taken the outputs at face value, my project’s rigor would have suffered from inaccurate data analysis and empty citations. None of the recommendations would be defensible. Human oversight remains critical when working with AI output in project contexts. To further the discussion, critical-incident reviews will be essential in helping project managers understand the root causes of these risks and support the future development of tools to manage them.
Additional Considerations
The heavy emphasis on business analysis may constrain project managers or product owners who are not familiar with analysis methods. In a casual conversation with a friend, I mentioned that in my decade-plus as a project manager, I have never been exposed to information theory or the supporting calculus involved with solving such equations. The most advanced equation I typically use is a PERT formula for calculating project durations. I am not even aware of information theory being used at the program level when decisions to choose a project are being made.
This knowledge gap challenged me when I had to reconcile the calculations, requiring extensive additional research to validate the equations, especially after Gemini hallucinated or omitted some calculations. Knowing which analysis framework to use from the outset would have been beneficial, as I came across MCDA by chance. My reconciliation likely would have needed less effort if I had planned to use this framework initially.
I also wonder what the outcome of my first iteration would have been if I had started with ChatGPT. My experience with that tool for other mathematical use cases has been more consistent and accurate than with Gemini. I may have avoided much of my rework.
As with any AI project, human oversight remains a fundamental requirement. The first draft of this report was underdeveloped and incorrect across multiple sections. Understanding the requirements of the deliverable and being able to infer assumptions based on available data and provided instructions is a skill AI has not mastered. The work very much remains knowledge based and it remains important that project managers and business analysts continue to upskill in the age of AI, so that they are equipped to maximize effective use of the tooling available to them. Despite instances where the tool does not produce the expected results, productivity gains are still realized by its use.
References
Chan, B. (2026). Day 2 Keynote: The Evolution of IoT in the Age of AI: How AI-Native Systems Redefine Cybersecurity and Trust. In M. Fagan, J. Marron, & B. Cuthill (Ed.), Workshop Summary Report for “Cybersecurity for IoT Workshop: Future Directions”. Gaithersburg, MD: National Institute of Standards and Technology. https://doi.org/10.6028/NIST.IR.8618
Dean, M. (2022). A Practical Guide to Multi-Criteria Analysis. https://doi.org/10.13140/RG.2.2.15007.02722
Dodgson, J., Spackman, M., Pearman, A., & Phillips, L. (2009). Multi-criteria analysis: a manual. Department for Communities and Local Government. Retrieved from https://www.researchgate.net/publication/30529921_Multi-Criteria_Analysis_A_Manual
Gładysz, B., & Kuchta, D. (2022). Sustainable Metrics in Project Financial Risk Management. Multidisciplinary Digital Publishing Institute, 14(21), 14247. https://doi.org/10.3390/su142114247
Google. (2026). Gemini Notebook. Retrieved from Gemini Notebook: https://notebook.google.com/
Larsen, A., Skjuve, M., Følstad, A., & van As, N. (2026). LLM Hallucinations in Conversational AI for Customer Service: Framework and End-User Perceptions. International Journal of Human–Computer Interaction, 42(13), 9807-9828. https://doi.org/10.1080/10447318.2025.2580540
Mallioris, P., Aivazidou, E., & Bechtsis, D. (2024). Predictive maintenance in Industry 4.0: A systematic multi-sector mapping. CIRP Journal of Manufacturing Science and Technology, 50, 80-103. https://doi.org/https://www.sciencedirect.com/science/article/pii/S1755581724000221
OpenAI. (2026). ChatGPT 5.6 [Large Language Model].
Pamučar, P., Bozanic, D., & Randjelovic, A. (2017). Multi-criteria decision making: An example of sensitivity analysis. Serbian Journal of Management, 12(1), 1-27. https://doi.org/10.5937/sjm12-9464
Payandeh, R., Delbari, A., Fardad, F., Helmzadeh, J., Shafiee, S., & Ghatari, A. (2025). Unraveling the potential of blockchain technology in enhancing supply chain traceability: A systematic literature review and modeling with ISM. Blockchain: Research and Applications, 6(1), 100240. https://doi.org/10.1016/j.bcra.2024.100240
Roszkowska, E. (2026). Entropy and Normalization in MCDA: A Data-Driven Perspective on Ranking Stability. Entropy, 28(1), 114. https://doi.org/10.3390/e28010114
Saura, J., Škare, V., & Dosen, D. (2024). Is AI-based digital marketing ethical? Assessing a new data privacy paradox. Journal of Innovation & Knowledge, 9(4), 100597. https://doi.org/10.1016/j.jik.2024.100597
Schuyler, J. (1995). Decision analysis in projects: utlity and multi-criteria decisions. PM Network, 9(4), 22-28. Retrieved from https://www.pmi.org/learning/library/decision-analysis-projects-utlity-multi-criteria-10379
Shabbir, R., Naveed, S., & Cheema, S. (2023). Evaluation of the Factors behind the Failure of Project Management Practices. Journal of Development and Social Sciences, 4(3), 490-501. https://doi.org/10.47205/jdss.2023(4-III)47
Sonntag, M., Mehmann, J., & Teuteberg, F. (2025). AI-Based Chatbots in Customer Service: A Task-Technology Fit (TTF) Model. International Journal of Service Science, Management, Engineering, and Technology (IJSSMET), 16(1), 1-20. https://doi.org/10.4018/IJSSMET.385128
Sourya, J., & Chattopadhyay, M. (2025). Privacy in Personalized Advertising: A Comprehensive Review and Future Agenda. Communications of the Association for Information Systems, 56(13), 305-342. https://doi.org/10.17705/1CAIS.05613
Stouffer, K., Pease, M., Lubell, J., Wallace, E., Reed, H., Martin, V., . . . Freeberg, C. (2022). Blockchain and related technologies to support manufacturing supply chain traceability : needs and industry perspectives. National Institute of Standards and Technology (U.S.). https://doi.org/10.6028/NIST.IR.8419
Vafaei, N., Ribeiro, R., & Camarinha-Matos, L. (2022). Assessing Normalization Techniques for Simple Additive Weighting Method. Procedia Computer Science, 199, 1229-1236. https://doi.org/10.1016/j.procs.2022.01.156
Wei, Y.-M. (2025). A Hybrid Multi-Criteria Decision-Making Framework for the Strategic Evaluation of Business Development Models. Multidisciplinary Digital Publishing Institute, 46(6), 454. https://doi.org/10.3390/info16060454
Yazdani, M., Pamucar, D., Chatterjee, P., & Torkayesh, A. (2022). “A multi-tier sustainable food supplier selection model under uncertainty”. Operations Management Research, 15(1-2), 116-145. https://doi.org/10.1007/s12063-021-00186-z